We tested four popular free statistics calculators on the same 12 homework-style problems and checked every answer against verified results. Social Science Statistics was the most complete free statistics calculator for course assignments, answering 11 of the 12 problems correctly with no workarounds needed for t-tests, chi-square or ANOVA. Desmos also handled 11, and is the best choice for graphs and regression, but it has no ANOVA and no proper paired t-test. GraphPad QuickCalcs answered 9 and gets t-tests right, but its normal-distribution table mislabels probabilities above the mean. Calculator.net covered only 3 problems and gave a wrong confidence interval for a small sample.
Below you'll find the exact problems, the correct answers, what each calculator returned, screenshots of the results that matter, and the traps that cause students to copy a wrong number into their homework. We have no affiliation with any of the tools tested.
Our Verdict: The Best Free Statistics Calculator for Each Job
| If you need to... | Use | Why |
|---|
| Run t-tests, chi-square tests and ANOVA for a stats course | Social Science Statistics | Covers almost every intro test, offers Welch's t-test by default, and shows both one- and two-tailed p-values |
| Graph data, fit a regression line or check quartiles visually | Desmos | Exact results to many digits, built-in chi-square tests, and graphs alongside the numbers |
| Run a quick unpaired or paired t-test with clear output | GraphPad QuickCalcs | Accurate t-tests and a step-by-step interface, with a few caveats below |
| Get basic descriptive statistics fast | Calculator.net | Fine for mean and standard deviation, but check which SD it labels as "Standard Deviation" |
How We Tested the Calculators
- Date and setup: October 12, 2026, using a current version of Chromium on desktop. Each calculator was run through all 12 problems in one session.
- Tools: Social Science Statistics, GraphPad QuickCalcs, Calculator.net and the Desmos graphing calculator. All are free and work in a browser without an account.
- Reference answers: every problem was solved with SciPy 1.15.3, a widely used open-source scientific computing library, and the key results were double-checked by hand.
- Recording results: we copied each output from the page text rather than retyping it, and took screenshots of the results discussed below.
- Scoring: a calculator got credit if it returned the correct value to the precision it displays. Rounding differences in the last digit didn't count against it. If a calculator offers no tool for a problem, we marked it as not offered rather than wrong.
Websites change, so a calculator may have been updated since our test. The problems and answers below let you rerun any of them yourself.
The 12 Problems and Their Correct Answers
| # | Problem | Data | Correct answer |
|---|
| 1 | Descriptive statistics | 12, 15, 11, 18, 14, 16, 13, 17, 15, 19 | Mean 15, median 15, sample SD 2.582, population SD 2.449 |
| 2 | Quartiles and IQR | 3, 7, 8, 5, 12, 14, 21, 13, 18 | Q1 7, Q3 14, IQR 7 (inclusive method); Q1 6, Q3 16, IQR 10 (exclusive method) |
| 3 | Normal probability | Mean 100, SD 15, value 120 | z = 1.333, P(X < 120) = 0.9088 |
| 4 | Binomial probability | n = 12, p = 0.3 | P(X = 4) = 0.2311, P(X ≤ 4) = 0.7237 |
| 5 | 95% confidence interval for a mean | Data from problem 1 | 13.153 to 16.847 |
| 6 | One-sample t-test | Data from problem 1, μ₀ = 14 | t(9) = 1.225, p = 0.252 |
| 7 | Two-sample t-test | 23, 25, 28, 30, 27, 26, 24 vs. 31, 29, 34, 33, 30, 35, 32, 28 | Pooled: t(13) = −4.257, p = 0.00093. Welch: t(12.79) = −4.262, p = 0.00096 |
| 8 | Paired t-test | Before 72, 68, 75, 80, 66, 70, 74, 78; after 75, 70, 74, 84, 70, 73, 77, 80 | t(7) = 4.410, p = 0.0031 |
| 9 | Chi-square goodness of fit | Observed 18, 22, 30, 30, equal expected | χ²(3) = 4.32, p = 0.229 |
| 10 | Chi-square test of independence | 2×3 table: 20, 30, 25 / 30, 20, 25 | χ²(2) = 4.00, p = 0.135 |
| 11 | One-way ANOVA | 78, 85, 82, 88, 80 / 72, 75, 70, 78, 74 / 85, 90, 88, 92, 86 | F(2, 12) = 23.81, p = 0.00007 |
| 12 | Linear regression | x: 2, 3, 5, 1, 4, 6, 7, 8; y: 65, 70, 78, 60, 72, 85, 88, 92 | y = 55.36 + 4.643x, r = 0.9955, R² = 0.991 |
Results: Which Calculators Got Each Problem Right
✓ means correct, ≈ means supported with a caveat or workaround, ✗ means a wrong answer, and "No tool" means the calculator has nothing for that problem.
| Problem | Social Science Statistics | GraphPad QuickCalcs | Calculator.net | Desmos |
|---|
| 1. Descriptive statistics | ≈ sample SD only | ≈ sample SD only | ✓ | ✓ |
| 2. Quartiles and IQR | ✓ both methods | No tool | No tool | ✓ exclusive method |
| 3. Normal probability | ✓ | ≈ table mislabeled above the mean | ✓ | ✓ |
| 4. Binomial probability | No tool (binomial test only) | ✓ | No tool | ✓ |
| 5. 95% confidence interval | ✓ | ✓ | ✗ uses z instead of t | ✓ |
| 6. One-sample t-test | ✓ | ✓ | No tool | ✓ |
| 7. Two-sample t-test | ✓ pooled and Welch | ≈ Welch df rounded to 12 | No tool | ✓ Welch only |
| 8. Paired t-test | ✓ | ✓ | No tool | ≈ needs a workaround |
| 9. Chi-square goodness of fit | ✓ | ✓ | No tool | ✓ |
| 10. Chi-square independence (2×3) | ✓ | No tool (2×2 tables only) | No tool | ✓ |
| 11. One-way ANOVA | ✓ | No tool | No tool | No tool |
| 12. Linear regression | ✓ | ≈ no r, p shown as < 0.0001 | No tool | ✓ no p-value |
| Problems answered | 11 of 12 | 9 of 12 | 3 of 12 (1 wrong) | 11 of 12 |
Calculator-by-Calculator Review
Social Science Statistics: Best Overall for Course Assignments
Social Science Statistics has a separate page for almost every test taught in an introductory course, from t-tests and chi-square tests to ANOVA, Mann-Whitney U and Pearson correlation. Every answer we could check matched the reference.
- Welch's t-test is the default for two independent samples, and the pooled version is one click away. Both matched exactly, including Welch's fractional degrees of freedom (12.7908).
- It shows one-tailed and two-tailed p-values side by side, which helps you match what your assignment asks for.
- You can choose the quartile method: inclusive (the default, matching Excel's PERCENTILE.INC) or exclusive. That is the only tool we tested that makes this choice visible.
- Limitations: it reports only the sample standard deviation, has no binomial probability calculator (only a binomial test), shows very small p-values as 0.000000, and its auto-generated summary sentences round heavily. It reported r = 0.9955 as "r = 1.00". The site also shows ads, one of which covered part of a form during our test.
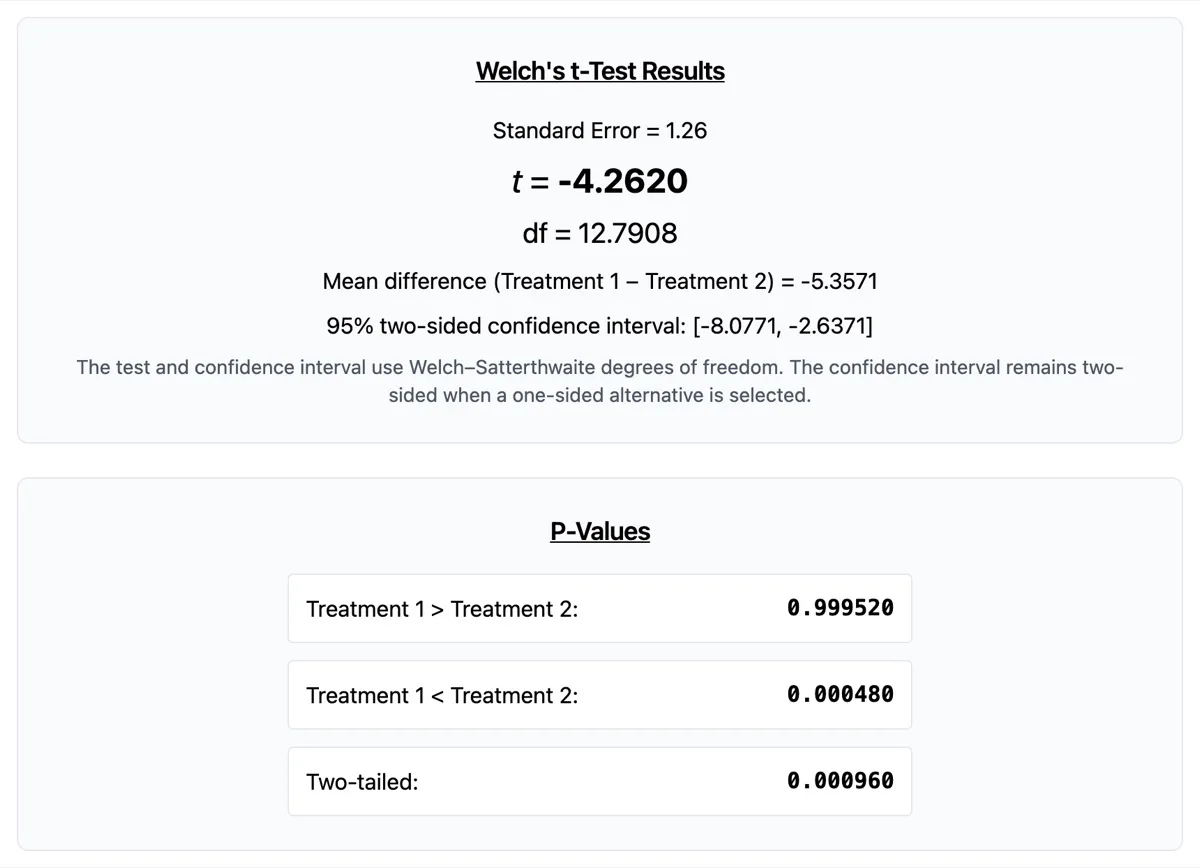
Social Science Statistics returned the exact Welch result for problem 7, including fractional degrees of freedom and both one-tailed p-values.
Desmos: Best for Graphs, Regression and Quick Checks
The Desmos graphing calculator is best known for graphing, but it has a surprising number of statistics functions: mean, median, stdev and stdevp, quartile, normal and binomial distributions, t-tests, regression and chi-square tests. Its results matched the reference to many digits.
- Chi-square tests are built in. chisqgof() and chisqtest() returned exact answers for problems 9 and 10.
- Regression is excellent. Typing y₁ ~ mx₁ + b fits the line, shows r and R², and plots it over your data.
- It uses the exclusive quartile method, giving Q1 = 6 and Q3 = 16 for problem 2. That's correct, but it won't match a textbook that uses the inclusive method.
- Watch out for t-tests. Two-sample tests are Welch only, with no pooled option. There is no paired t-test, and typing ttest(after, before) silently runs an independent-samples test, which gave p = 0.318 instead of 0.0031. For paired data, test the differences instead: ttest(after − before). You also can't type the hypothesized mean inside ttest(); set it in the test panel.
- No ANOVA, and the regression output doesn't include a p-value for the slope.
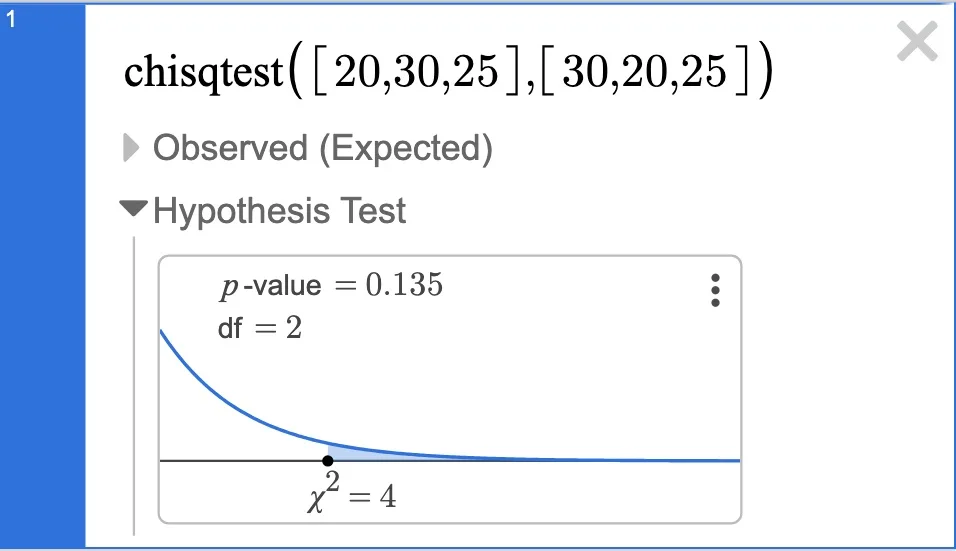
Desmos handles chi-square tests with chisqtest(), shown here returning the correct result for problem 10.
GraphPad QuickCalcs: Good t-Tests, One Misleading Table
GraphPad QuickCalcs comes from the makers of Prism, a statistics package widely used in the life sciences. Its step-by-step forms are clear, and its unpaired, paired and one-sample t-tests matched the reference.
- The normal distribution table mislabels values above the mean. For a mean of 100 and SD of 15, the row for X = 119.8 lists 9.342% under "Less than X" and 90.658% under "Greater than X." The correct proportion below 119.8 is about 90.66%, so those two columns are swapped for every value above the mean. Rows below the mean are correct. The table also uses a fixed grid of values, so you can't look up X = 120 directly.
- Welch's test reports whole-number degrees of freedom. It showed df = 12 and p = 0.0011, where the exact values are 12.79 and 0.00096. The difference rarely changes a conclusion, but it won't match an answer key that expects the exact value. GraphPad also labels Welch's test "used rarely," even though many statisticians now recommend it as the default.
- Other limits: no quartiles, chi-square tables limited to 2×2, no one-way ANOVA in the free calculators, p-values reported only down to "< 0.0001," and t-statistics shown without their sign.
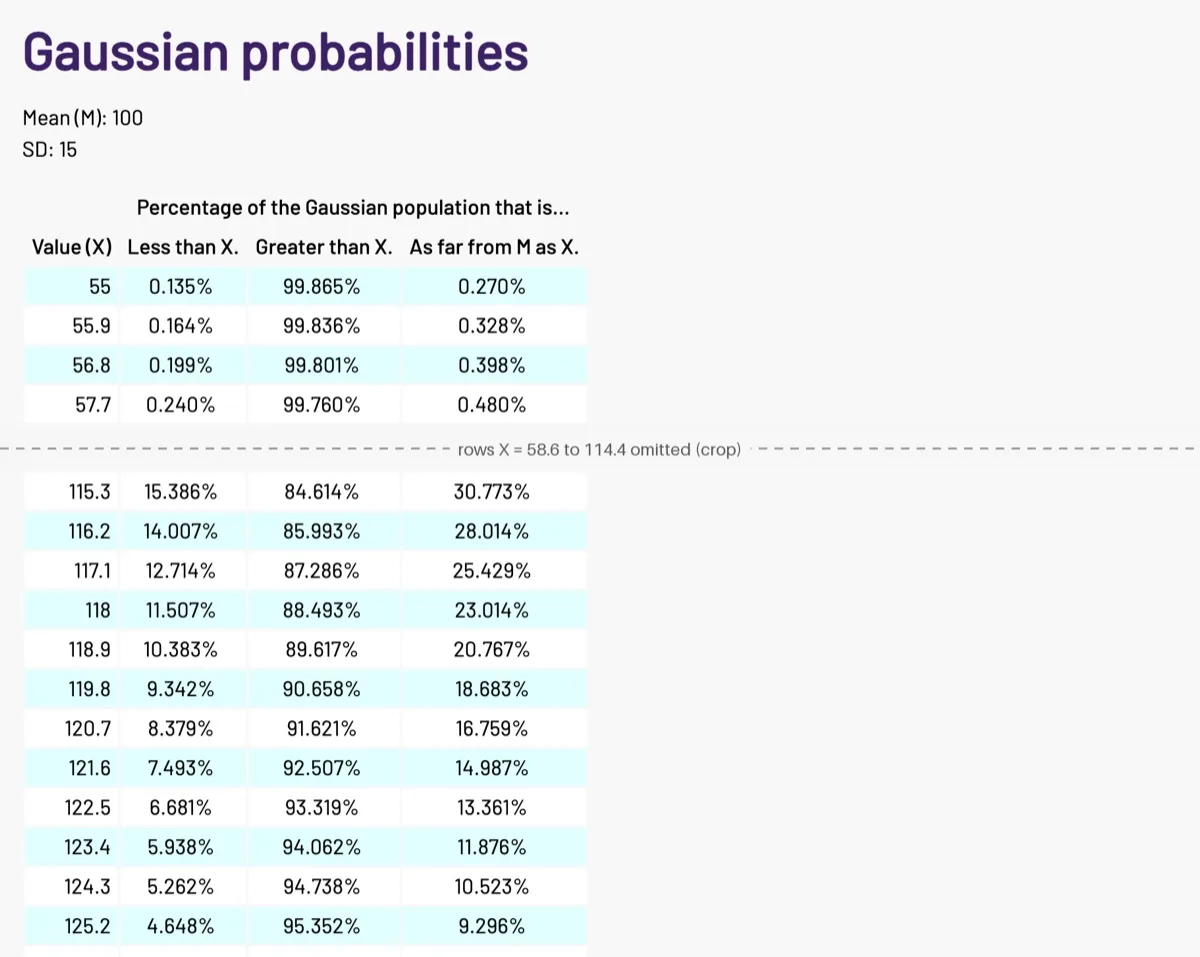
In GraphPad's Gaussian table, rows above the mean show the "Less than X" and "Greater than X" values the wrong way around. At X = 119.8, about 90.66% of values are actually below X.
Calculator.net: Fine for Basics, Wrong for Small-Sample Intervals
Calculator.net offers quick descriptive statistics, a z-score calculator with normal probabilities, and a confidence interval calculator. It has no t-tests, chi-square tests, ANOVA, regression or binomial calculator.
- Descriptive statistics were correct, but the statistics calculator labels the population standard deviation as plain "Standard Deviation" (2.449) and lists the sample SD (2.582) separately. Most courses expect the sample SD, so check which one you copy.
- The confidence interval calculator uses z = 1.96 even for small samples. For problem 5 it returned 13.400 to 16.600 instead of the correct t-interval of 13.153 to 16.847. With 10 observations and an unknown population SD, the interval should use t with 9 degrees of freedom (critical value 2.262), so its interval is too narrow. It also requires the mean and SD rather than raw data.
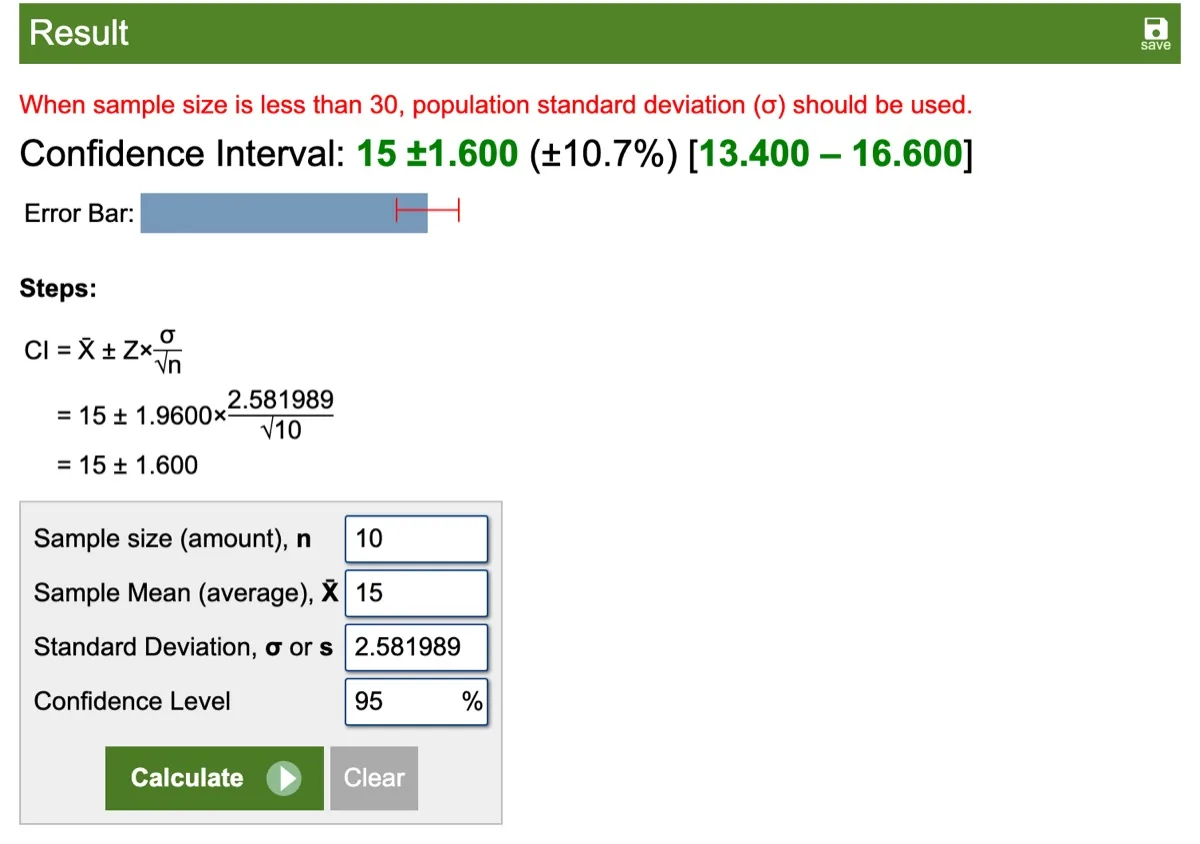
Calculator.net's confidence interval for problem 5 uses z = 1.96. For a sample of 10 with an estimated SD, the correct t-based interval is wider: 13.153 to 16.847.
Five Calculator Traps That Cost Students Points
1. Sample vs. Population Standard Deviation
For problem 1, the sample SD is 2.582 and the population SD is 2.449. Calculators label these differently, and one of the four we tested put the population value under the plain label "Standard Deviation." If your data is a sample, which it almost always is in homework, use the sample SD, often labeled s or STDEV.S.
2. Different Quartile Methods
For the nine values in problem 2, legitimate methods give either Q1 = 7 and Q3 = 14 (IQR 7) or Q1 = 6 and Q3 = 16 (IQR 10). Neither is wrong, but your answer key uses one of them. Check which method your textbook or instructor uses. TI-84 calculators and Desmos use the exclusive method, while Excel's QUARTILE.INC uses the inclusive one.
3. z Instead of t for Confidence Intervals
When you estimate the population SD from your sample, a confidence interval for the mean should use the t distribution. Using z = 1.96 makes the interval too narrow, especially for small samples. Our guide on which statistical test to use explains when t and z apply.
4. Welch vs. Pooled t-Tests
For two independent groups, calculators default to different versions. Pooled and Welch results are close when the group SDs are similar, as in problem 7, but can differ a lot when they aren't. Use the version your course specifies, and report the degrees of freedom exactly as the test computes them.
5. Paired Data Entered as Two Independent Groups
If the same people were measured twice, you need a paired test. In problem 8 the correct paired p-value is 0.0031, but running the same numbers as an independent test gives 0.318. That's the difference between a significant result and a non-significant one.
Which Calculator Should You Use?
- For an introductory statistics course, start with Social Science Statistics. It covers nearly every test you'll meet and makes method choices visible.
- For regression, graphs or a quick check of a result, use Desmos, and remember its paired-test and quartile behavior.
- For t-tests in a biology or health course, GraphPad works well, but don't use its Gaussian table for values above the mean.
- For only mean and standard deviation, Calculator.net is fine, as long as you copy the right SD.
Whatever you use, solve one problem by hand or with a second tool before trusting a new calculator. A calculator gives you a number, not a reason, and most statistics marks come from choosing the right method and interpreting the result. Our guide to variability in statistics covers what standard deviation and IQR actually measure.
When a Calculator Isn't Enough
Free calculators are ideal for single tests. They're less helpful when an assignment involves real data files, several variables, assumption checks, or a written results section. For those projects, software such as R, SPSS, jamovi or JASP is a better fit, and many universities provide it free. If you're stuck on a statistics assignment, our statistics homework help connects you with tutors who can check your method and explain the output. Use any outside help in line with your school's academic integrity policy.
Frequently Asked Questions
What Is the Best Free Statistics Calculator Online?
In our test of four free calculators on 12 problems, Social Science Statistics was the most complete for course assignments, answering 11 of 12 with no workarounds. Desmos also answered 11 and is best for graphs and regression, but has no ANOVA.
Which Free Calculator Can Do a t-Test?
Social Science Statistics, GraphPad QuickCalcs and Desmos all run t-tests. Social Science Statistics offers both pooled and Welch versions, GraphPad offers both with whole-number Welch degrees of freedom, and Desmos offers only Welch and has no built-in paired test.
Can Desmos Do Statistics?
Yes. Desmos calculates descriptive statistics, quartiles, normal and binomial probabilities, t-tests, chi-square tests and regression. It doesn't do ANOVA, and paired t-tests require testing the differences.
Why Does My Calculator Give a Different Quartile than My Textbook?
There are several accepted ways to calculate quartiles, and they give different answers for small data sets. Check which method your course uses and choose a calculator that matches it.
Should I Use z or t for a Confidence Interval?
Use t when the population standard deviation is unknown and you estimate it from your sample, which is almost always the case in homework. Use z only when the population standard deviation is genuinely known.